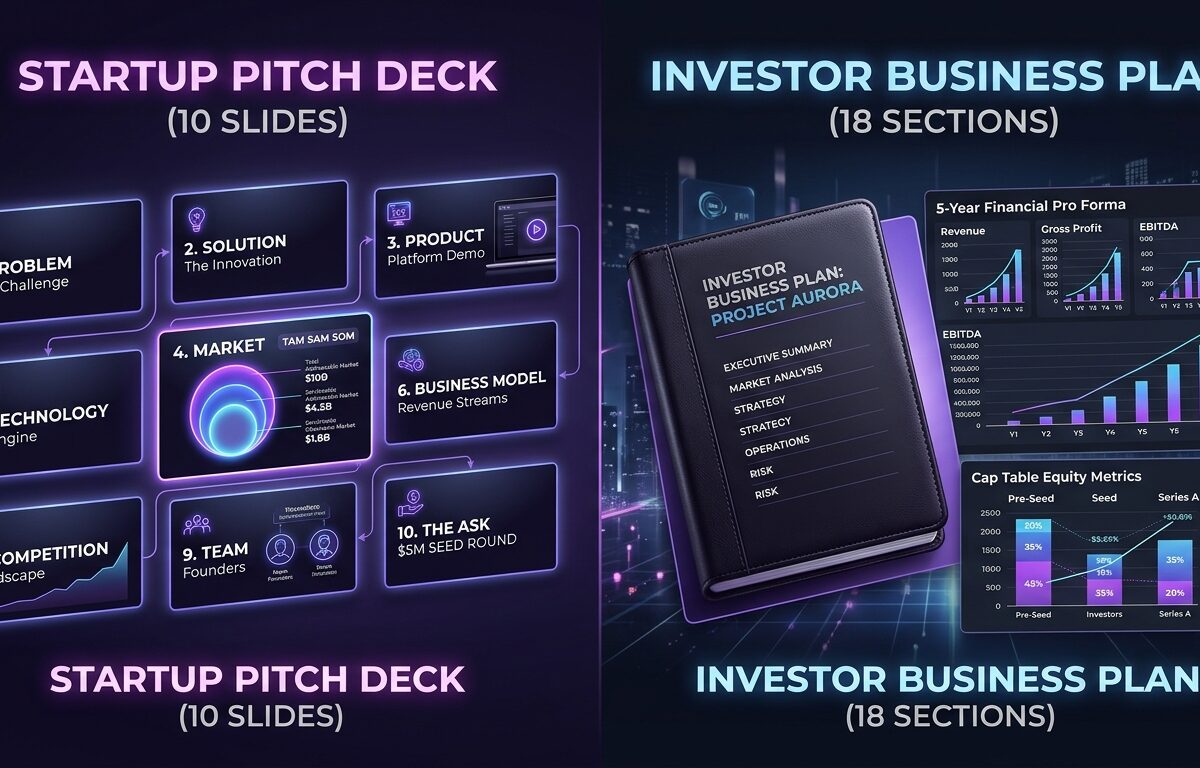
A pitch deck is a 10-to-12 slide visual overview used to capture investor attention and secure an initial partner meeting. A business plan is a comprehensive 18-section dossier detailing unit economics, TAM/SAM/SOM arithmetic, and 5-year integrated financial pro formas required by investment committees during formal due diligence before signing a term sheet.
Executive Summary: The Modern Venture Funding Dual-Asset Mandate
A common debate among early-stage founders is whether to build a pitch deck or write a business plan. Conventional tech blog advice frequently claims that venture capitalists and angel investors “never read business plans.” That assertion misunderstands how institutional capital allocation operates.
In actual seed, Series A, and venture debt workflows, founders need both assets, deployed at distinct stages of the capital-raising pipeline:
[Outreach & Initial Screening]           [Confirmatory Due Diligence]
  10 to 12-Slide Pitch Deck      ───►      18-Section Business Plan
  • Goal: Secure the 30-min meeting        • Goal: Secure Investment Committee (IC) sign-off
  • Time spent: 2 min 42 sec (DocSend)     • Time spent: 10 to 20 partner/associate review hours
• Format: Visual narrative, traction • Format: Defensible unit economics, 5-yr model, TAM- The Pitch Deck serves as your top-of-funnel marketing collateral. It captures interest, demonstrates market momentum, and earns an introductory partner call.
- The Investor Business Plan serves as your middle-and-bottom-funnel audit dossier. When an investment syndicate enters formal due diligence, associates and general partners stress-test your unit economics, regulatory defenses, capitalization structure, and financial pro formas.
A pitch deck opens the dialogue; an institutional business plan closes the round. Below is the operational benchmark comparison, timeline deployment matrix, market sizing framework, and financial modeling standard required to pass tier-one institutional diligence in 2026.
—
1. 10-Slide Pitch Deck vs. 18-Section Investor Business Plan Breakdown
The table below contrasts each slide of the standard 10-slide venture deck (Sequoia Capital / Kawasaki format) with the corresponding analytical section of an institutional 18-section business plan.
| Slide # / Deck Focus | Deck Content & Visual Footprint | Business Plan Section | Business Plan Content & Diligence Depth | Due Diligence Function |
|---|---|---|---|---|
| Slide 1: Title & Purpose | Company name, one-sentence thesis, founder contacts. (15-25 words) | Section 1: Executive Summary & Legal Structure | Entity type (Delaware C-Corp), cap table summary, founding date, headquarters, IP ownership breakdown. (500-750 words) | Legal verification & baseline governance structure. |
| Slide 2: Problem Statement | 3 bulleted pain points experienced by a identifiable customer segment. (30-50 words) | Section 2: Market Problem & Industry Inefficiencies | Quantitative quantification of annual financial waste, regulatory shifts driving urgency, and failure modes of incumbent tools. (800-1,200 words) | Validates that the problem represents an urgent budget line item, not an optional convenience. |
| Slide 3: Solution & Value Prop | High-level product screenshot, value proposition, core customer benefit. (20-40 words) | Section 3: Proprietary Solution & Technical Architecture | Software schematics, API integrations, data flows, proprietary algorithms, patent filings, and user onboarding flows. (1,000-1,500 words) | Confirms technological feasibility, data privacy posture, and intellectual property defensibility. |
| Slide 4: Market Sizing (TAM) | Three nested circles: TAM, SAM, SOM in billions/millions. (15-30 words) | Section 4: Addressable Market Analysis (TAM/SAM/SOM) | Both top-down industry data and bottom-up arithmetic (ACV × qualified accounts), geographical rollout tiers, and penetration rates. (800-1,200 words) | Prevents valuation collapse caused by disproven addressable market ceilings. |
| Slide 5: Product & Traction | Timeline of shipped features, active ARR, MoM growth percentage. (30-60 words) | Section 5: Historical Traction & Cohort Retention | Net Revenue Retention (NRR), Gross Churn, cohort survival curves, pilot conversion rates, and signed letters of intent (LOIs). (1,000-1,500 words) | Proves product-market fit (PMF) via repeat usage and low churn cohorts. |
| Slide 6: Business Model | Pricing tiers (e.g., $99/mo SaaS, usage fee) and gross margin target. (25-45 words) | Section 6: Monetization, Pricing Power & Margin Structure | Detailed monetization levers, contract lengths, expansion revenue triggers, billing cycles, COGS breakdown, and payment processing fees. (800-1,200 words) | Confirms gross margins meet venture benchmarks (75-85% for SaaS; 30-45% for marketplaces). |
| Slide 7: Go-To-Market (GTM) | 3 primary customer acquisition channels (e.g., Paid Ads, SEO, Outbound SDRs). (30-50 words) | Section 7: Customer Acquisition Strategy & Sales Operations | Blended vs. paid CAC calculations, inbound content velocity, sales rep quota ramp times, channel partner commissions, and LTV:CAC ratios. (1,200-1,800 words) | Demonstrates scalable, repeatable distribution economics. |
| Slide 8: Competitive Landscape | 2×2 matrix or quadrant chart placing your logo in the top-right corner. (20-40 words) | Section 8: Competitive Moat & Threat Mitigation Matrix | Direct, indirect, and latent competitor teardowns, switching cost calculations, feature parity roadmaps, and defensive moat longevity. (1,000-1,500 words) | Demonstrates founder awareness of hostile incumbent responses. |
| Slide 9: Management Team | Headshots, previous logos (Google, Stanford, Ex-Founder), and titles. (25-50 words) | Section 9: Key Personnel, Advisory Board & Hiring Plan | Full professional CVs, domain expertise, past exit records, key equity vests, advisory compensation, and 24-month executive hiring gaps. (600-1,000 words) | Audits execution capability and key-person operational risk. |
| Slide 10: The Ask & Financial Summary | Capital sought ($2M), 18-month milestones, and high-level revenue bar chart. (30-60 words) | Section 10–18: Capital Allocation, 5-Year Pro Forma & Sensitivity Model | 60-month Integrated Three-Statement Model (P&L, Balance Sheet, Cash Flow), hiring plans, CapEx, run-rate milestones, and stress tests. (2,500-4,000 words) | Fulfills fiduciary underwriting requirements for fund principals and LPs. |
—
2. When Angels and VCs Require Each Asset: The 5-Stage Investment Lifecycle
Founders who send an unsolicited 35-page business plan as their initial cold email attachment experience near-zero open rates. Conversely, founders who arrive at an Investment Committee partner meeting with only a 10-slide deck frequently get stalled in due diligence.
Institutional funding progresses through five discrete stages, each demanding specific documentation:
┌─────────────────────────────────────────────────────────────────────────────┐
│                       VENTURE CAPITAL PIPELINE LIFECYCLE                    │
├─────────────────┬──────────────────┬─────────────────┬──────────────────────┤
│ STAGE           │ PRIMARY AUDIENCE │ ASSET REQUIRED  │ DECISION GATE        │
├─────────────────┼──────────────────┼─────────────────┼──────────────────────┤
│ 1. Cold Screen  │ Scout / Analyst  │ 10-Slide Deck   │ "Is this thesis      │
│                 │                  │ (PDF / DocSend) │  worth 30 minutes?"  │
├─────────────────┼──────────────────┼─────────────────┼──────────────────────┤
│ 2. First Call   │ Senior Associate │ Pitch Deck +    │ "Does the founder    │
│                 │ / Junior Partner │ 1-Page Teaser   │  understand the math?"│
├─────────────────┼──────────────────┼─────────────────┼──────────────────────┤
│ 3. Deep Diligence│ Lead Partner +  │ Full 18-Section │ "Are the operations  │
│                 │ Diligence Team   │ Business Plan   │  and claims solid?"  │
├─────────────────┼──────────────────┼─────────────────┼──────────────────────┤
│ 4. IC Review    │ General Partners │ 5-Year Model +  │ "Does this meet our  │
│                 │ & Fund Committee │ Data Room Plan  │  10x return mandate?"│
├─────────────────┼──────────────────┼─────────────────┼──────────────────────┤
│ 5. Term Sheet   │ Managing Partner │ Cap Table +     │ Legal signature and  │
│    & Wire       │ & Fund Counsel   │ Final Disclosures│ wire transfer       │
└─────────────────┴──────────────────┴─────────────────┴──────────────────────┘
Stage 1: Cold and Warm Screening (The Pitch Deck Domain)
- Review Environment: Venture capital associates review an average of 40 to 60 pitch decks per week. According to DocSend benchmarking, investors spend an average of 2 minutes and 42 seconds on an initial pitch deck review.
- Mandatory Requirements: 10 to 12 slides in PDF format or a secure link (DocSend). The deck must articulate the core problem, customer traction, and round size within the first 60 seconds.
- Rule: Never attach full financial models or comprehensive narrative business plans at this stage.
Stage 2: Initial Partner Screen & Product Demo
- Review Environment: A 30-to-45 minute video conference or in-person pitch with a venture partner or angel syndicate lead.
- Mandatory Requirements: The pitch deck serves as the conversational backdrop. In addition, founders should have a 1-Page Executive Summary ready to distribute immediately following the meeting to summarize the investment thesis, current revenue, cap table status, and terms.
Stage 3: Commercial & Technical Due Diligence (The Business Plan Entry Point)
- Review Environment: The venture firm assigns an associate or principal to conduct confirmatory diligence over a two- to four-week period.
- Mandatory Requirements: This is the moment the 18-Section Investor Business Plan is requested. Diligence teams require clear documentation of market size, go-to-market channels, customer acquisition economics, competitive barriers, regulatory exposure, and technical system architecture.
- The Risk of Not Having a Plan: If diligence associates uncover that your assumptions on churn, server costs, or CAC are undocumented, the deal frequently loses momentum and dies in committee.
Stage 4: Financial Underwriting & Investment Committee (IC) Memo
- Review Environment: The deal lead drafts an internal Investment Committee (IC) Memorandum. The IC includes all General Partners who control fund capital.
- Mandatory Requirements: The partner synthesizes data directly from your business plan narrative and your 5-Year Pro Forma Financial Model. The committee scrutinizes gross margin sustainability, operating expense burn rates, customer concentration risk, and cash break-even timelines.
Stage 5: Term Sheet Issuance & Legal Close
- Review Environment: Outside legal counsel executes background checks, IP assignment audits, and confirmatory capitalization table audits.
- Mandatory Requirements: The disclosures and financial statements in your business plan serve as representations that support the definitive purchase agreements (Series Seed or NVCA Series A documents).
—
### 💡 Generate an Institutional-Grade Investor Business Plan
Preparing for angel syndicate or venture capital due diligence? Skip the 6-week drafting cycle and $3,500 consulting fees.
Raising Angel or Venture Capital?
Use the BizPlan AI Pro Investor-Ready Business Plan Generator to build an 18-section, investor-compliant business plan complete with bottom-up TAM/SAM/SOM calculations and dynamic 5-year pro forma financials.
Generate Investor-Ready Plan ($15) →Pricing: Professional package at $15.00 one-time fee (includes 5 business plans, unwatermarked PDF & Word exports, and 50 AI Business Coach consultation credits) or Enterprise at $39.00 one-time fee for advanced capitalization and multi-scenario modeling. No recurring subscriptions.
—
3. TAM, SAM, and SOM Market Sizing Methodology
One of the quickest ways to lose credibility with angel investors and venture capitalists is submitting an arbitrary top-down market estimate (e.g., “The global logistics market is $8 trillion; if we capture just 1%, we will be an $80 billion company”). Institutional analysts reject top-down hand-waving because it fails to calculate real pricing power, buyer density, and distribution limits.
Investors demand a bottom-up market sizing methodology that isolates the Total Addressable Market (TAM), Serviceable Available Market (SAM), and Serviceable Obtainable Market (SOM).
┌────────────────────────────────────────────────────────────────────────┐
│                        MARKET SIZING HIERARCHY                         │
│                                                                        │
│   ┌────────────────────────────────────────────────────────────────┐   │
│   │ TAM: Total Addressable Market                                  │   │
│   │ Total universal demand if 100% of the target market purchased   │   │
│   │                                                                │   │
│   │   ┌────────────────────────────────────────────────────────┐   │   │
│   │   │ SAM: Serviceable Available Market                      │   │   │
│   │   │ Segment targeted by your direct product and geography   │   │   │
│   │   │                                                        │   │   │
│   │   │   ┌────────────────────────────────────────────────┐   │   │   │
│   │   │   │ SOM: Serviceable Obtainable Market             │   │   │   │
│   │   │   │ Realistic 3 to 5-year capture based on budget  │   │   │   │
│   │   │   └────────────────────────────────────────────────┘   │   │   │
│   │   └────────────────────────────────────────────────────────┘   │   │
│   └────────────────────────────────────────────────────────────────┘   │
└────────────────────────────────────────────────────────────────────────┘
Definitions and Operational Formulas
1. Total Addressable Market (TAM)
The universal annual revenue opportunity if your product achieved 100% market share across every eligible customer profile globally, assuming no geographic or channel constraints. $$\text{TAM} = \text{Total Potential Customers Worldwide} \times \text{Annual Contract Value (ACV)}$$
2. Serviceable Available Market (SAM)
The proportion of the TAM that aligns directly with your current product features, language support, regulatory scope, and active geographic distribution channels. $$\text{SAM} = \text{Target Segment Customers in Active Geographies} \times \text{Realized ACV}$$
3. Serviceable Obtainable Market (SOM)
The practical, defensible market share your company can capture within the next 36 to 60 months, constrained by your marketing budget, sales rep headcount, quota capacity, and competitive churn dynamics. $$\text{SOM} = \text{SAM} \times \text{Projected Market Penetration Percentage (typically 1\% to 5\% over 3–5 years)}$$ Or via bottom-up sales velocity: $$\text{SOM} = (\text{Fully Ramped Sales Reps} \times \text{Annual Quota Target}) + \text{Inbound Channel Run-Rate}$$
—
Step-by-Step Bottom-Up Calculation Example: B2B Compliance SaaS
Consider a startup building an AI-powered regulatory compliance platform for mid-market financial institutions in North America and Western Europe:
| Metric | Target Segment | Unit Count | Unit Pricing (ACV) | Calculation | Total Value |
|---|---|---|---|---|---|
| TAM (Global) | All regulated depository institutions, credit unions, and asset managers worldwide | 142,000 institutions | $48,000 / year | $142,000 \times \$48,000$ | $6.816 Billion |
| SAM (Regional & Product Fit) | Mid-market banks ($500M–$10B in AUM) in the US, UK, and Canada subject to FINRA/SEC/FCA scrutiny | 11,500 qualified institutions | $48,000 / year | $11,500 \times \$48,000$ | $552.0 Million |
| SOM (3-Year Execution Target) | Mid-market institutions captured by a 12-person enterprise sales team over 36 months (2.8% SAM penetration) | 320 signed institutions | $48,000 / year | $320 \times \$48,000$ | $15.36 Million ARR |
Top-Down vs. Bottom-Up Diligence Comparison
| Sizing Dimension | Top-Down Approach (Rejected by VCs) | Bottom-Up Approach (Investor Benchmark) |
|---|---|---|
| Primary Data Source | Aggregated secondary industry reports (Gartner, Statista, IBISWorld). | Verified business registries, census microdata, LinkedIn Sales Navigator filters, Dunn & Bradstreet records. |
| Price Point Assumption | Blended industry average expenditure across all market tiers. | Granular contract tiers reflecting proven willingness to pay by customer tier. |
| Capacity Constraints | Assumes market share is captured automatically by product presence. | Factored against sales cycle duration (e.g., 90-day sales cycles, $800k sales quota per AE). |
| Diligence Audit Result | Heavily discounted by venture partners as ungrounded speculation. | Validated line-by-line in the financial pro forma and hiring schedule. |
—
4. 5-Year Pro Forma Financial Standards for Institutional Due Diligence
Angel investors and venture capitalists review financial projections to evaluate your operational logic, cost discipline, and understanding of unit economics.
A compliant 5-year financial pro forma must feature three integrated statements (Income Statement / P&L, Balance Sheet, and Cash Flow Statement) broken down into monthly increments for Years 1 and 2, transitioning to quarterly or annual summaries for Years 3 through 5.
┌──────────────────────────────────────────────────────────────────────────┐
│                   INTEGRATED THREE-STATEMENT DILIGENCE ARCHITECTURE      │
├──────────────────────────┬───────────────────────┬───────────────────────┤
│ INCOME STATEMENT (P&L)   │ BALANCE SHEET         │ CASH FLOW STATEMENT   │
├──────────────────────────┼───────────────────────┼───────────────────────┤
│ • Gross Revenue Streams  │ • Cash & Equivalents  │ • Operating Cash Flow │
│ • Cost of Goods (COGS)   │ • Accounts Receivable │ • Investing (CapEx)   │
│ • Gross Profit & Margin  │ • Fixed Assets/Tech   │ • Financing (Equity)  │
│ • OPEX (R&D, S&M, G&A)   │ • Accounts Payable    │ • Net Cash Burn Rate  │
│ • EBITDA / Net Income    │ • Retained Earnings   │ • Runway / Zero-Date  │
└──────────────────────────┴───────────────────────┴───────────────────────┘
Essential Financial Statements and Structural Rules
1. The Income Statement (Profit & Loss)
- Revenue Recognition: Clearly separate recurring revenue (ARR/MRR) from one-off professional implementation or onboarding fees.
- Cost of Goods Sold (COGS): Must include direct infrastructure costs (AWS/GCP/Azure hosting), third-party API queries (e.g., OpenAI, Stripe transaction fees), and dedicated customer success/support labor. Software gross margins must remain within 70% to 85%.
- Operating Expenses (OPEX): Categorized into three standard venture divisions:
- Research & Development (R&D): Software engineers, product managers, UI/UX designers.
- Sales & Marketing (S&M): Account Executives, SDRs, paid ad spend, conference sponsorships, content marketing.
- General & Administrative (G&A): Legal, accounting, office facilities, executive compensation, corporate insurance.
2. The Balance Sheet
- Working Capital Management: Reflects lag between invoice generation and cash receipt (Days Sales Outstanding / DSO, typically modeled at 30 to 60 days for enterprise accounts).
- Capital Expenditures (CapEx): Details hardware, proprietary server builds, or office leasehold improvements.
- Capitalization Record: Retained earnings must tie directly to cumulative Net Income, with paid-in capital matching equity financing rounds.
3. The Cash Flow Statement
- Cash Burn Tracking: Distinguishes Gross Burn (total monthly cash outflow) from Net Burn (Gross Burn minus monthly cash collections).
- Runway Milestones: Highlights the minimum cash balance point and the exact month where external capital is required or cash-flow breakeven is reached.
—
Benchmark Venture Financial Profile (5-Year Projection Model)
The table below outlines a standard financial trajectory for a venture-backed B2B software enterprise scaling from post-seed through Series B:
| Financial Metric | Year 1 (Seed Stage) | Year 2 (Post-Seed) | Year 3 (Series A) | Year 4 (Expansion) | Year 5 (Scale / Series B) |
|---|---|---|---|---|---|
| Annual Recurring Revenue (ARR) | $450,000 | $1,800,000 | $5,200,000 | $12,500,000 | $26,000,000 |
| Gross Margin (%) | 74.0% | 78.5% | 81.2% | 82.5% | 83.8% |
| Customer Acquisition Cost (CAC) | $4,200 | $3,800 | $3,400 | $3,100 | $2,950 |
| Average Contract Value (ACV) | $18,000 | $21,000 | $24,000 | $26,500 | $28,000 |
| Customer Lifetime Value (LTV) | $54,000 | $72,000 | $96,000 | $118,000 | $132,000 |
| LTV : CAC Ratio | 12.8x | 18.9x | 28.2x | 38.0x | 44.7x |
| CAC Payback Period (Months) | 11.2 months | 8.8 months | 6.5 months | 5.2 months | 4.8 months |
| Net Revenue Retention (NRR) | 102% | 110% | 118% | 124% | 128% |
| Headcount (FTEs) | 8 | 19 | 42 | 84 | 145 |
| Operating Cash Flow | -$980,000 | -$1,450,000 | -$820,000 | +$1,150,000 | +$5,800,000 |
| Cumulative Equity Capital Raised | $1,500,000 | $3,500,000 | $10,500,000 | $10,500,000 | $10,500,000 |
Stress-Testing and Scenario Sensitivity Models
Investors verify risk exposure by running sensitivity models across three distinct scenarios:
- Base Case: Expected operating performance supported by existing cohort conversion rates and planned sales hiring timelines.
- Conservative Case (Downside Shock): Sales cycles lengthen by 40%, customer acquisition costs rise by 35%, and top-line ARR achieves only 60% of target. The model must demonstrate how management adjusts hiring to preserve at least 12 months of cash runway without emergency bridge financing.
- Aggressive Case (Upside Expansion): Viral adoption or channel partnerships double customer acquisition without increasing headcount linearly, showing how excess cash flow is reinvested into R&D and international expansion.
—
### 📊 Need Investor-Compliant Pro Forma Financials?
Manually building an integrated three-statement financial model in Excel can consume dozens of hours and often introduces circular reference formula errors.
Raising Angel or Venture Capital?
The BizPlan AI Pro Investor-Ready Business Plan Generator automatically builds complete 5-year pro formas with dynamic Income Statements, Balance Sheets, and Cash Flow schedules based on your industry benchmarks.
Generate Investor-Ready Plan ($15) →– Professional Package ($15.00 One-Time): Generates complete 5-year financials, bottom-up TAM/SAM/SOM tables, unwatermarked PDF & Word exports, and 50 AI Business Coach consultation credits.
– Enterprise Package ($39.00 One-Time): Delivers 15 business plans, multi-scenario sensitivity modeling, and 150 AI consultation credits for multi-founder teams.
Zero monthly recurring subscriptions. Lifetime access to your downloaded assets.
—
5. The Complete 18-Section Investor Business Plan Format
When your syndicate enters confirmatory due diligence, having a structured data room document ready prevents delays. Below is the full 18-section format required by tier-one angels, venture capital networks, and institutional growth funds:
Section 1: Executive Summary & Investment Thesis
The high-level summary of the company. It encapsulates the core problem, proprietary solution, market opportunity, current revenue traction, total capital requested, and projected 5-year return profile.
Section 2: Company Profile, Corporate History & Entity Structure
Details the corporate entity (e.g., Delaware C-Corporation), state of incorporation, date of inception, physical headquarters, active subsidiaries, and a clean summary of current stock ownership and authorized share classes.
Section 3: Market Problem & Industry Pain Points
A comprehensive review of the market inefficiency. Documents why legacy solutions fail, calculates direct customer cost waste, and identifies the regulatory, behavioral, or technical tailwinds making this problem urgent.
Section 4: Proprietary Solution & Product Architecture
An in-depth explanation of the company’s product or service. Outlines system architecture, data processing workflows, proprietary technology or trade secrets, user interfaces, patent applications, and production scalability.
Section 5: Market Sizing & Opportunity Validation (TAM, SAM, SOM)
A bottom-up arithmetic derivation of the addressable market. Combines qualified account counts with contract values to establish defensible market size boundaries across domestic and international expansion vectors.
Section 6: Target Customer Profile & Buyer Personas
Granular profiles of the Economic Buyer, Technical Decision-Maker, and End User. Details buying criteria, budget authorization levels, sales friction points, and customer success requirements.
Section 7: Competitive Landscape & Defensive Moats
A thorough competitive teardown analyzing direct, indirect, and incumbent competitors. Explains the company’s structural defensive moats (e.g., network effects, proprietary data assets, high switching costs, or patent protection).
Section 8: Go-To-Market (GTM) Strategy & Distribution Channels
The detailed operational plan for scaling customer acquisition. Covers inbound content marketing, paid acquisition efficiency, outbound SDR/AE territory structures, strategic alliances, and channel partner programs.
Section 9: Unit Economics, Pricing Models & Sales Cycles
Documents average contract values (ACV), gross margins, customer acquisition cost (CAC), customer lifetime value (LTV), LTV:CAC ratios, sales cycle duration, and contract renewal structures.
Section 10: Product Development Roadmap & Milestone Schedule
A 24-to-36-month timeline of planned product releases, architectural upgrades, security certifications (SOC 2, ISO 27001, HIPAA), and international localization rollouts.
Section 11: Regulatory, Compliance & Risk Management Framework
A detailed analysis of industry regulations, legal liabilities, data privacy mandates (GDPR, CCPA), cybersecurity measures, and proactive risk mitigation protocols.
Section 12: Management Team, Governance & Advisory Board
Professional background profiles of the founders, executive leadership, and board members. Highlights relevant domain exits, academic credentials, key operational achievements, and equity vesting schedules.
Section 13: Organizational Chart & 24-Month Hiring Schedule
Outlines existing departmental headcounts and projects month-by-month hiring needs across Engineering, Sales, Marketing, Customer Success, and Operations, including planned salary bands.
Section 14: Historical Operating Performance & Key Milestones
A record of historical performance to date. Tracks cumulative capital raised, grant awards, product release dates, customer growth rates, and historical monthly profit and loss figures.
Section 15: 5-Year Income Statement (P&L) Projections
A full 60-month projection of revenues, cost of goods sold (COGS), departmental operating expenses (R&D, S&M, G&A), EBITDA, and net earnings under Base, Conservative, and Aggressive operational cases.
Section 16: 5-Year Balance Sheet & Capital Expenditures Schedule
Projects assets, liabilities, working capital shifts, accounts receivable timelines, and planned hardware, software, or property investments.
Section 17: 5-Year Cash Flow Statement & Burn Analysis
Integrates operating, investing, and financing cash flows. Calculates monthly gross burn, net burn, cash runway depletion, and the exact cash-flow breakeven point.
Section 18: Capitalization Table, Funding Ask & Use of Proceeds
Specifies the exact funding amount requested, target valuation or convertible note cap/discount, planned allocation of proceeds (e.g., 50% Engineering, 35% GTM, 15% G&A), and expected milestone achievements prior to the subsequent financing round.
—
Frequently Asked Questions (FAQ)
Author

Related Articles